1. The chart below shows the annual pay (thousands of US dollars) for doctors and other workers in seven countries in 2004.
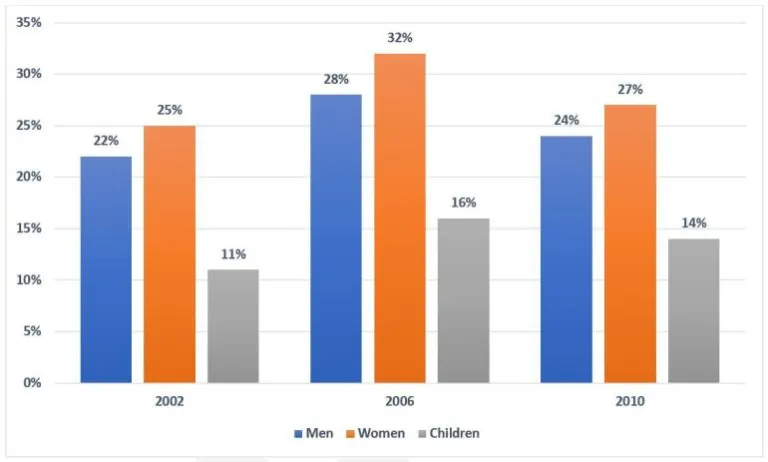
2. The chart below shows the percentage of the population in the UK who consumed the recommended daily amount of fruit and vegetables in 2002, 2006, and 2010.
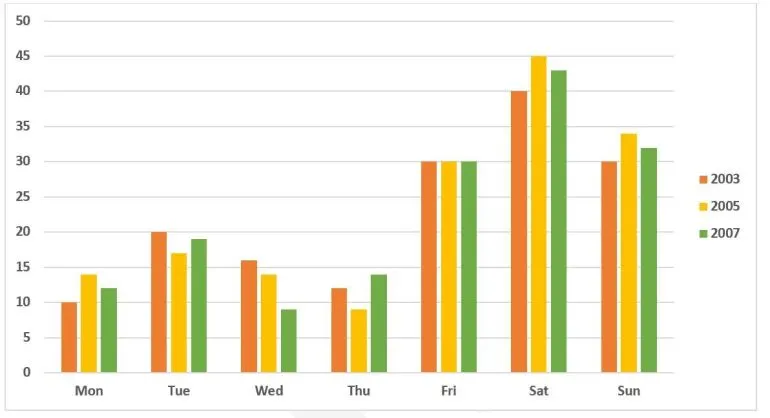
3. The bar shows the percentage of people going to cinemas in one European country on different days.
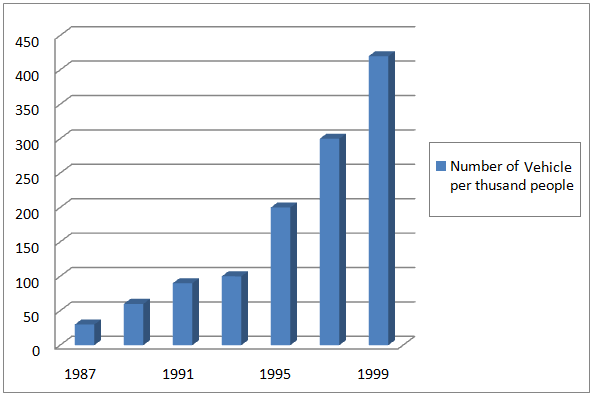
4. The bar chart below gives information about vehicle ownership in China. Write a report for a university lecturer describing the information.
5. The charts below show the Medical research funding amount in millions of Dollars in Someland and also shows the death number for this area.