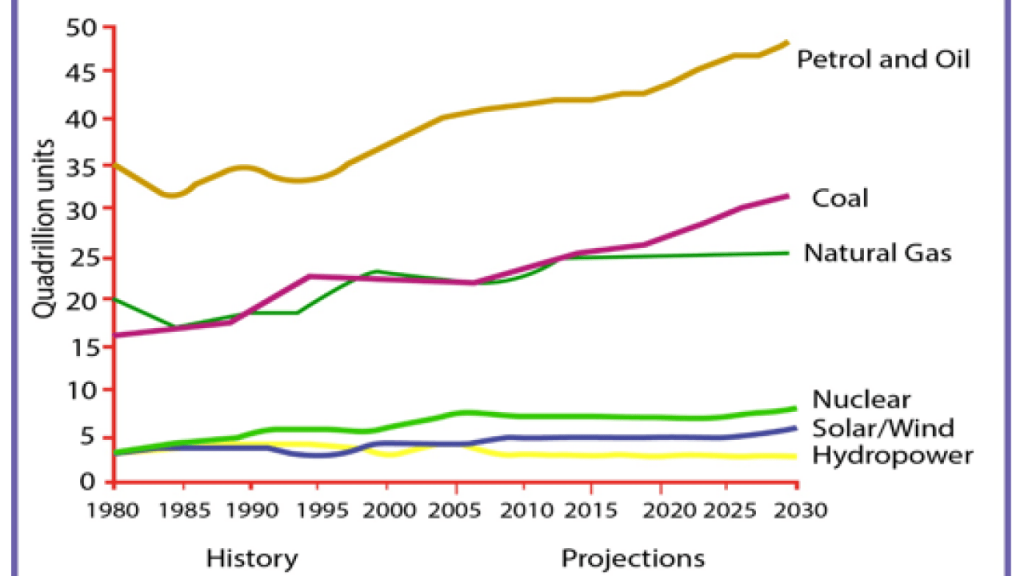
1. The graph below gives information from a 2008 report about the consumption of energy in the USA since 1980 with projections for 2030. Summarise the information by selecting and reporting the main features, and make comparisons where relevant.
2. The graph below shows the number of tourists visiting a particular Caribbean island between 2010 and 2017. Summarise the information by selecting and reporting the main features, and make comparisons where relevant.
3. The graph below shows the percentage of people in different age groups in one city who attended music concerts between 2010 and 2015. Summarise the information by selecting and reporting the main features, and make comparisons where relevant.
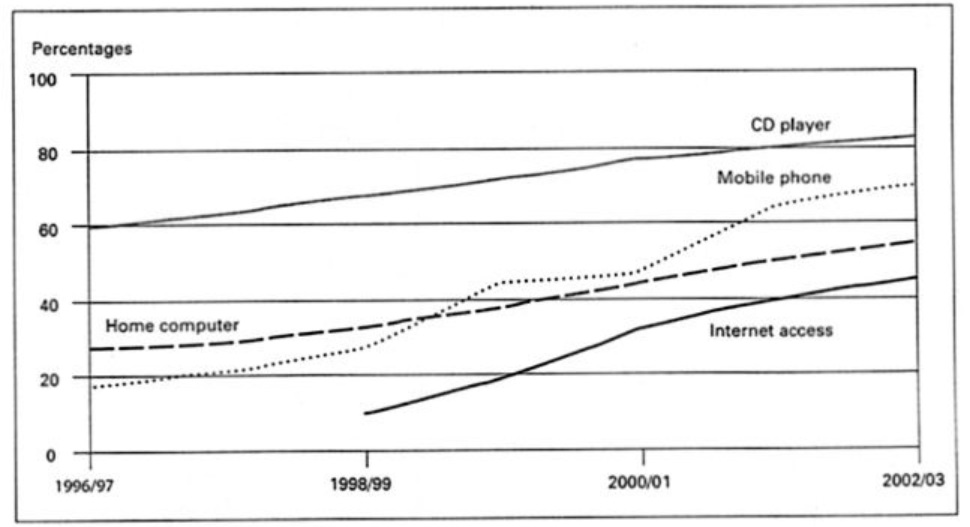
4. The graph shows in percentage terms the changing patterns of domestic access to modern technology in homes in the UK. Summarise the information by selecting and reporting the main features, and make comparisons where relevant.
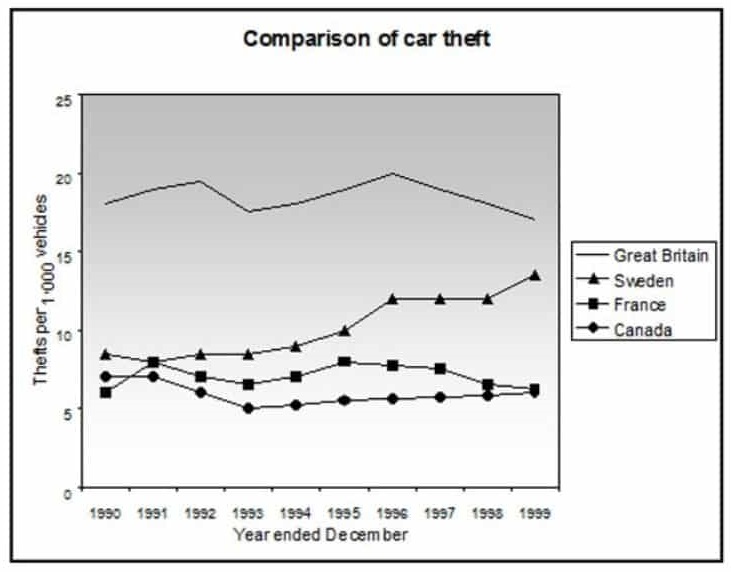
5. The line graph shows thefts per thousand vehicles in four countries between 1990 and 1999. Summarise the information by selecting and reporting the main features, and make comparisons where relevant.
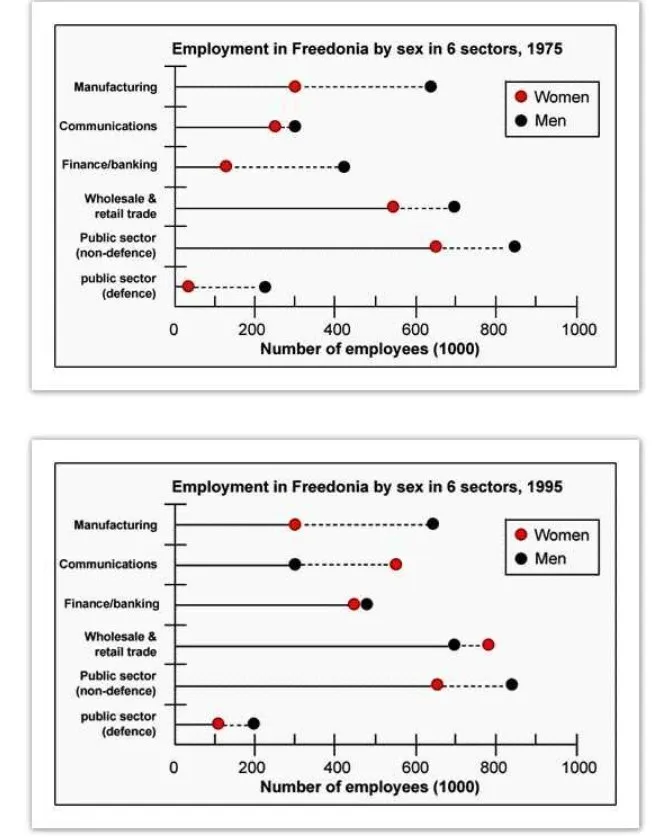
6. The graphs below show the numbers of male and female workers in 1975 and 1995 in several employment sectors of the Republic of Freedonia. Summarise the information by selecting and reporting the main features, and make comparisons where relevant.