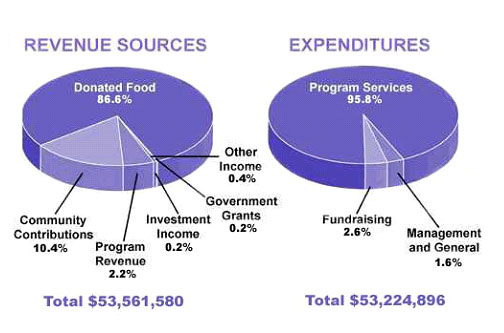
The pie chart shows the amount of money that a children’s charity located in the USA spent and received in one year. Summarise the information by selecting and reporting the main features, and make comparisons where relevant.
2. Three pie charts show the proportions of Korean video games in terms of gender, age, and best-selling games in 2003. Summarise the information by selecting and reporting the main features, and make comparisons where relevant.
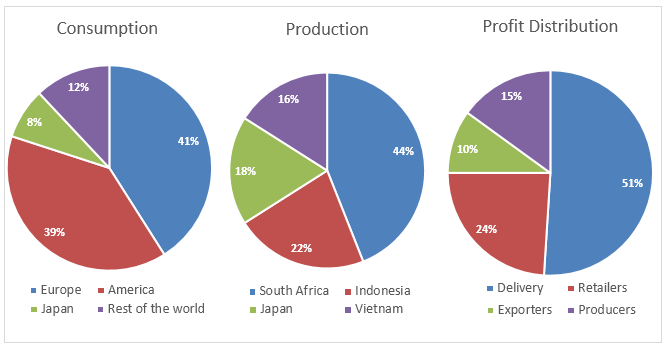
3. The pie charts below show the coffee production, coffee consumption, and profit distribution around the world. Summarise the information by selecting and reporting the main features, and make comparisons where relevant.
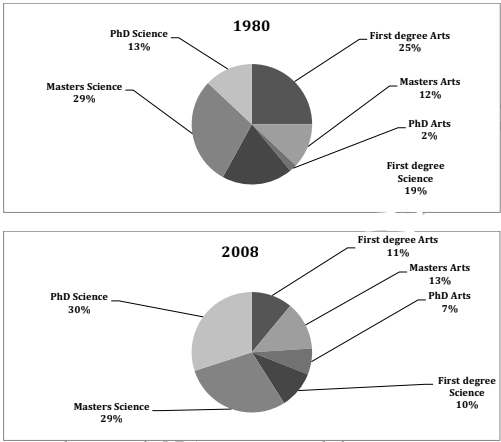
4. Two pie charts show a comparison of the proportion of people with different degrees (first degree, master’s) and (Arts, science) who worked in an engineering company in 1980 and 2008. Summarise the information by selecting and reporting the main features, and make comparisons where relevant.
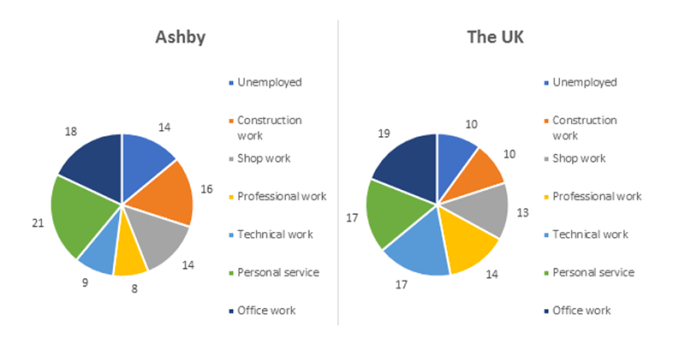
5. The charts below show the percentage of people aged 23-65 in different occupations in one UK town (Ashby) and in the UK as a whole in 2008. Summarise the information by selecting and reporting the main features, and make comparisons where relevant.
6. The chart below shows the electricity consumption in different sectors of Eastern Europe in 2007 and 2010. Summarise the information by selecting and reporting the main features, and make comparisons where relevant.